User friction
Due to constant friction with the service (like confusing steps, unclear responsibilities, and unintuitive terminology) many users had stopped reporting issues, relying on workarounds instead. It was difficult to tell which problems had the biggest impact or how widespread they were, making it hard to prioritize improvements with confidence. We needed a clearer view of the user experience to uncover hidden pain points, distinguish between isolated and systemic issues, and lay the groundwork for meaningful, targeted change.
Goals
User
- Understand users’ pain points and identify moments of friction throughout their journey.
- Detect recurring problems and unmet needs that were not visible through support tickets alone.
Business
- Prioritize improvements based on user impact and reach.
- Set a research-based foundation to rethink and redesign the service with confidence.
Process
Interviews with users to uncover frustrations
We interviewed a wide range of users, representing different roles and levels of interaction with the service. Each session lasted 30–45 minutes and followed a script, but we left room for natural conversations. This helped us spot both recurring issues and unexpected frustrations. I conducted several of these interviews myself.
Quantitative data to support patterns
I worked with the data analysts to identify relevant metrics. This allowed us to expand and contextualize the findings from the interviews. It also helped us distinguish between isolated pain points and systemic ones.
Mixed insights for a complete picture
The combination of interviews and data gave us a more accurate view of the user experience. For example, if users mentioned confusing steps, we could check usage data to confirm patterns like unusually long completion times or miscategorizations.
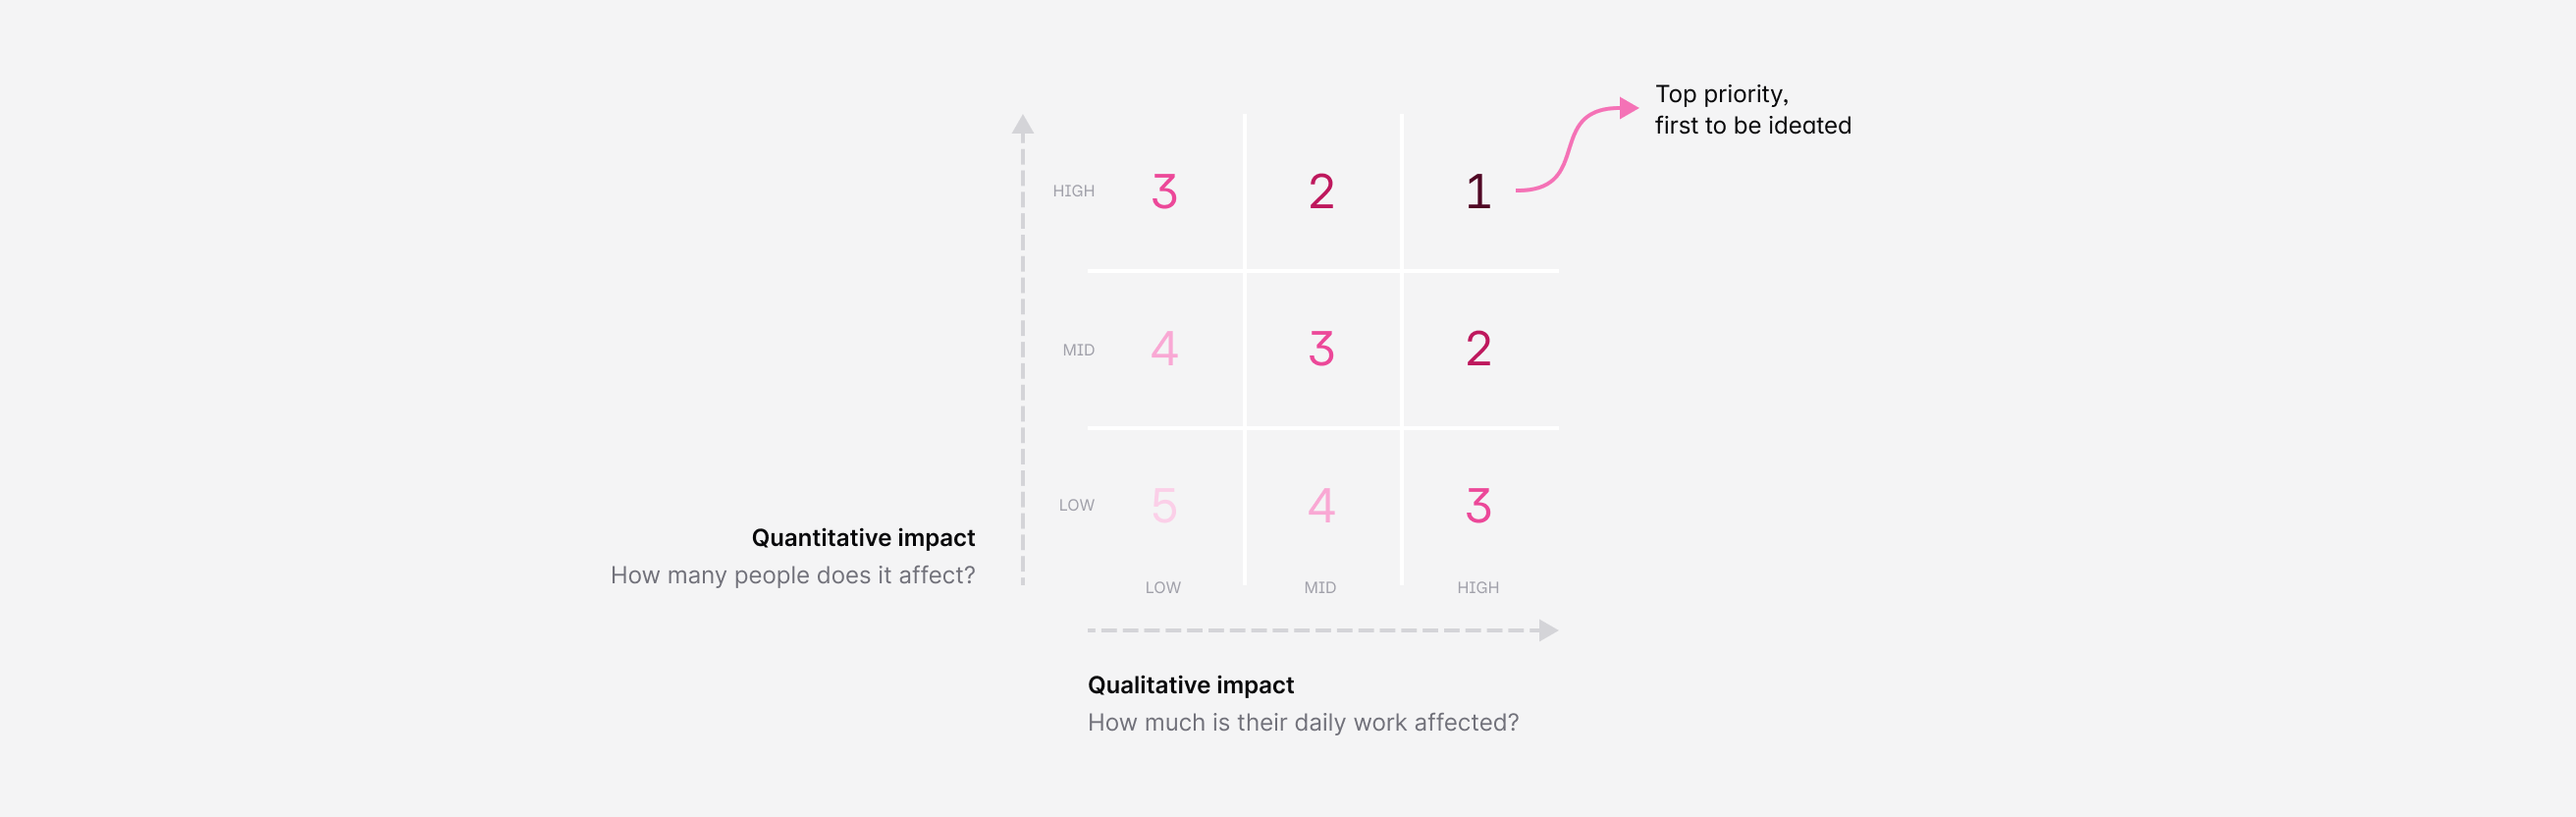
Prioritization based on impact
Once we had the findings, we sorted them using two key criteria: how much they affected users’ daily work (qualitative), and how many users were impacted (quantitative). This gave us a clear way to prioritize what to tackle first and ensured we focused on improvements with the highest impact potential.
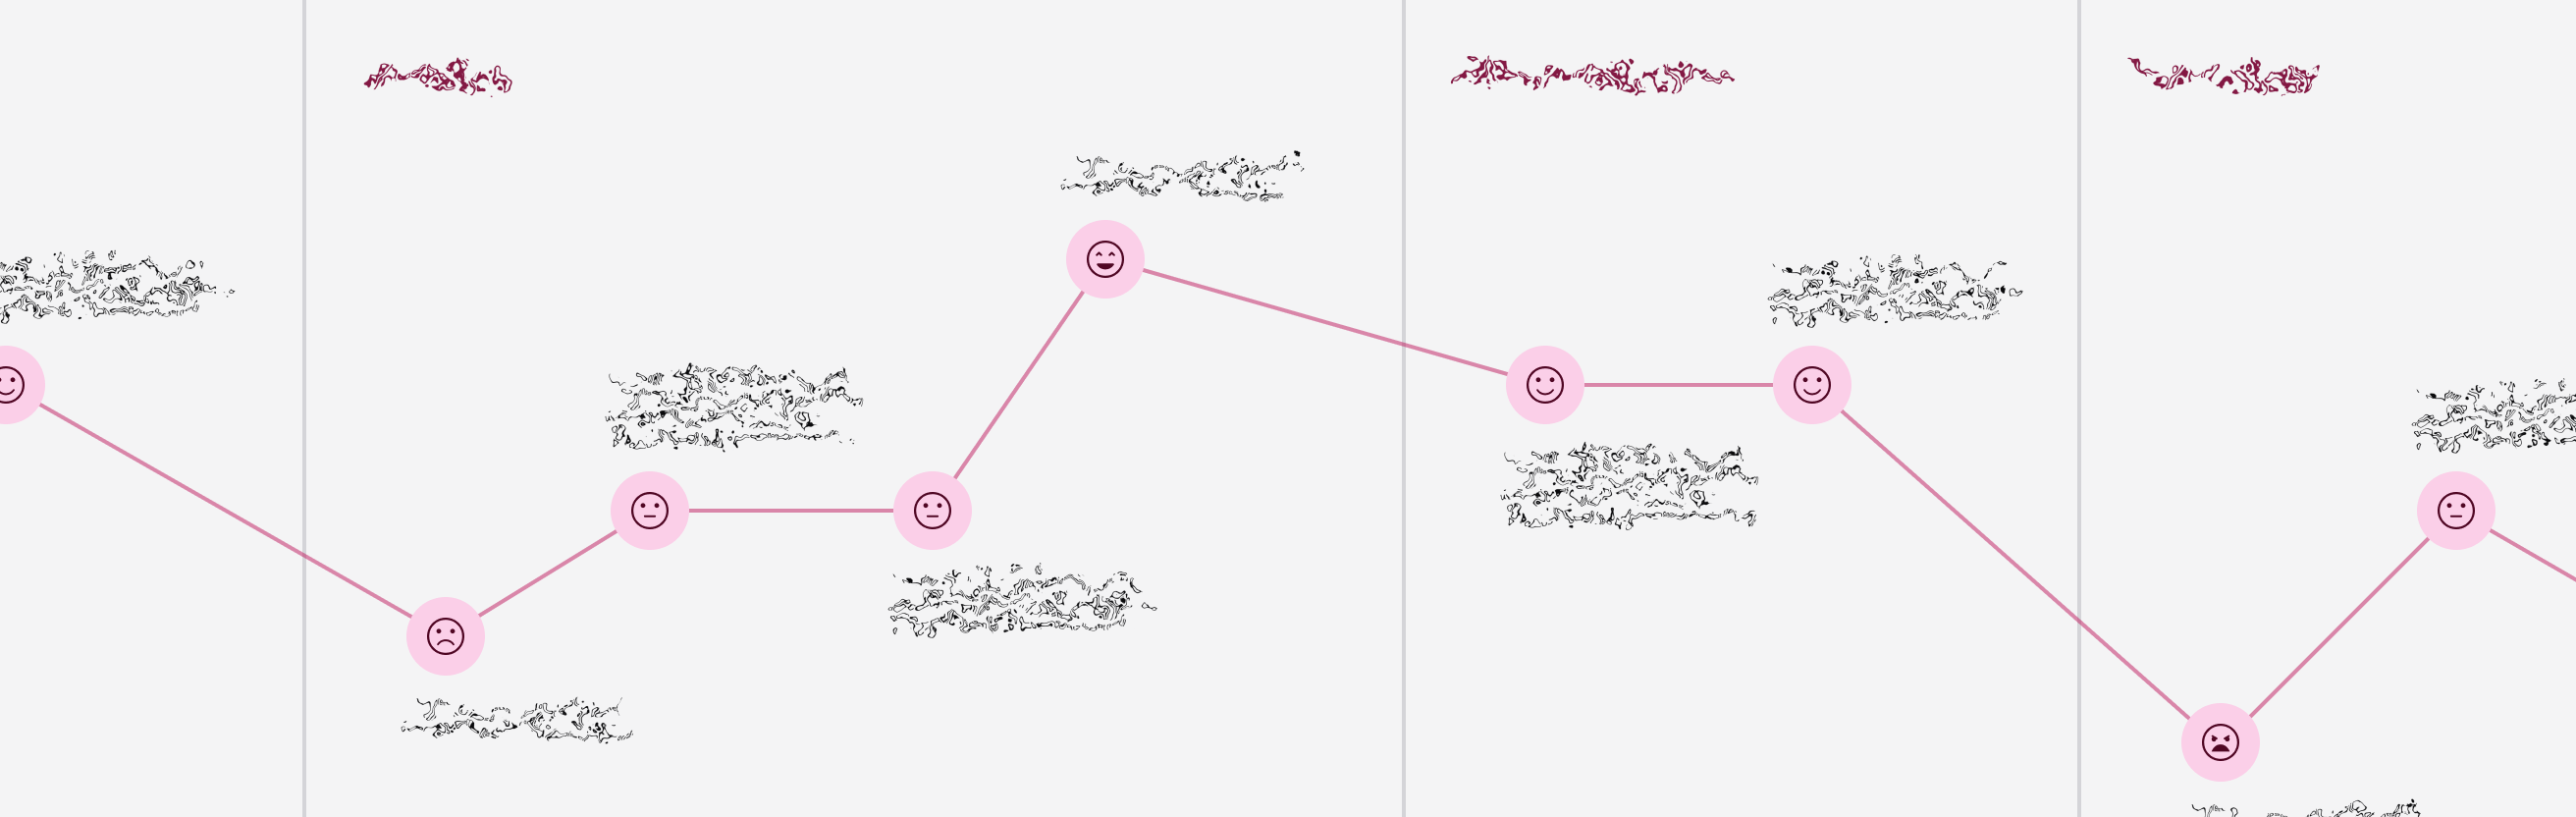
Mapping the journey
To make the insights actionable and shareable, I created a printable journey map. I captured all the findings in a structured, visual way, making it easier for stakeholders and teams unfamiliar with the research to understand the full picture at a glance.
Ideation sessions to turn findings into solutions
With the problems clearly defined, we ran collaborative ideation workshops within the design team and with other team members and stakeholders. These sessions helped turn insights into tangible user-centered proposals.
Prototypes to explore and discuss new features
To spark discussion with other team members and the client, we designed mid-fidelity prototypes and diagrams illustrating proposed changes to the service. These were used in reviews to gather early feedback, align expectations, refine concepts and explore possible technical challenges.

Results
We identified 38 opportunities for improvement. These ranged from interface issues and confusing terminology to service-level problems like unclear responsibilities or lack of communication.
The research became the foundation for collaborative ideation workshops, where the team started designing targeted, user-centered solutions. It also sparked conversations about how to involve users earlier in future service design projects.
This project showed how research can shift the direction of a service, not by guessing what users need, but by actually listening to them and backing it with data.